

The coronavirus pandemic caused an unprecedented economic shock in the UK, closing businesses and putting people out of work left, right and centre.
But despite that, average house prices held up across England – even if there was a drop in sales.
It was the same picture in Dacorum, where prices rose by 4.2 per cent in the year to September 2020. Across the East of England, prices rose by 2.2 per cent.
The ONS also publishes house price figures by Middle Layer Super Output Areas (MSOAs) – small geographic areas containing an average of 7,200 people.
These show 14of the 22 neighbourhoods (MSOAs) that make up Dacorum saw a rise in house prices over the same period.
Here we reveal which neighbourhoods saw the strongest growth in the year to September 2020.
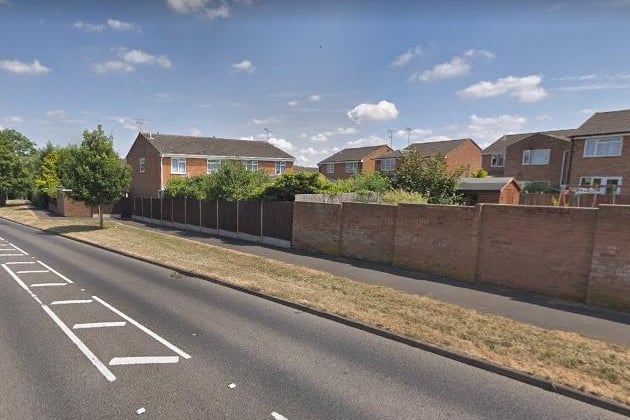
1. Woodhall Farm
The biggest price hike was in Woodhall Farm where the average price rose to £298,103 up by 18.7 per cent on the year to September 2019. Overall, 59 houses changed hands here between October 2019 and September 2020, a drop of 24 per cent. Photo: Google Maps
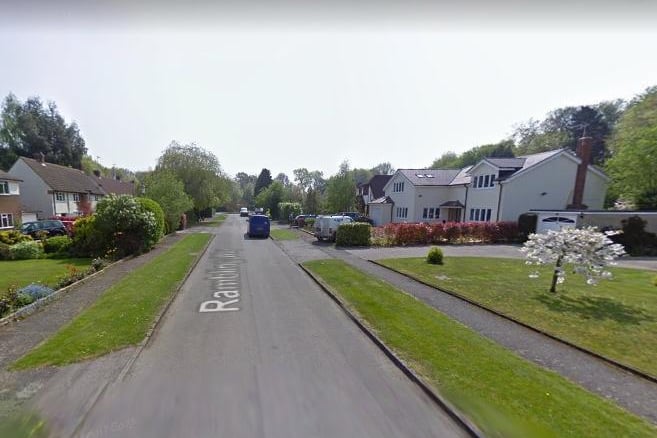
2. Northchurch and Potten End
The second biggest price hike was in Northchurch and Potten End where the average price rose to £764,053, up by 9.1 per cent on the year to September 2019. Overall, 49 houses changed hands here between October 2019 and September 2020, a drop of 37 per cent. Photo: Google Maps
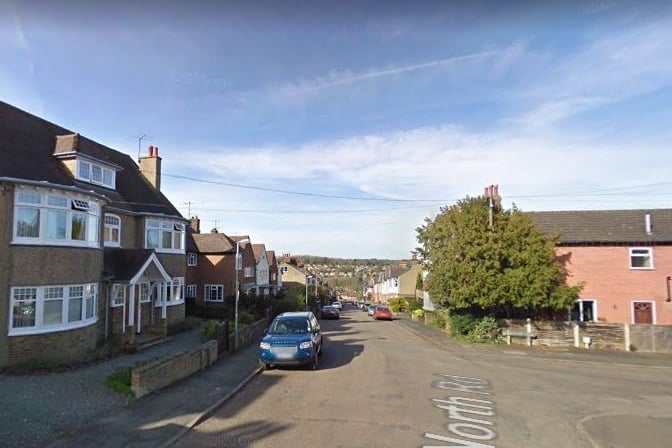
3. Berkhamsted South
The third biggest price hike was in Berkhamsted South where the average price rose to £693,158, up by 8.9 per cent on the year to September 2019. Overall, 64 houses changed hands here between October 2019 and September 2020, a drop of 29 per cent. Photo: Google Maps
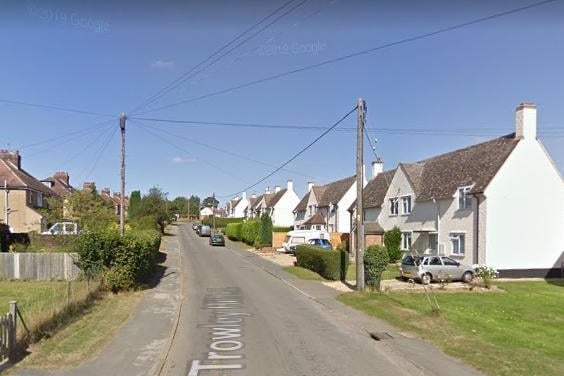
4. Markyate, Flamstead and Gaddesden
The fourth biggest price hike was in Markyate, Flamstead and Gaddesden where the average price rose to £443,479, up by 8.9 per cent on the year to September 2019. Overall, 65 houses changed hands here between October 2019 and September 2020, a drop of 17 per cent. Photo: Google Maps