All neighbourhoods in Dacorum record rise in Covid-19 cases
and live on Freeview channel 276
Tuesday's figures show there have been a total of 29,098 confirmed cases of coronavirus in Dacorum.
The incidence rate in Dacorum over the seven days up to December 23, was 1664.8 cases per 100,000 population, higher than the rate per 100,000 for England, which was 1,207.4.
Advertisement
Hide AdAdvertisement
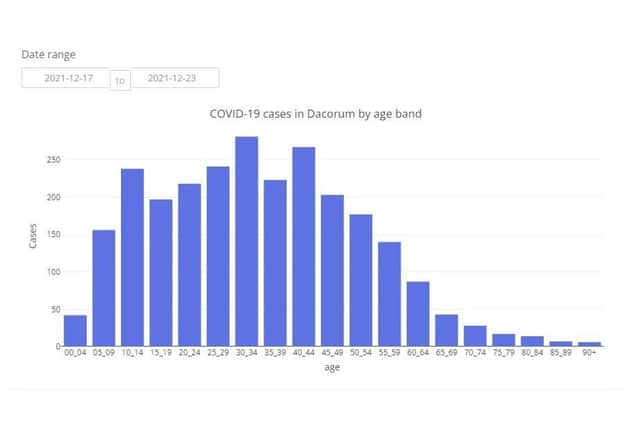
Hide AdHere is a breakdown of where the confirmed cases were recorded seven days up to December 23, - according to Public Health England:

> Bovingdon and Chipperfield - 152 cases (+56). Rate per 100,000 people: 1,633.9.
> Boxmoor and Apsley - 198 cases (+70). Rate per 100,000 people: 1,692.9.
> Corner Hall - 124 cases (+74). Rate per 100,000 people: 2,013.
Advertisement
Hide AdAdvertisement
Hide Ad> Chaulden - 81 cases (+37). Rate per 100,000 people: 1,559.5.
> Gadebridge and Old Town - 101 cases (+51). Rate per 100,000 people: 1,795.2.
> Grovehill - 123 cases (+74). Rate per 100,000 people: 1,535.6.
> Hemel Hempstead Town - 214 cases (+83). Rate per 100,000 people: 1,844.8.
Advertisement
Hide AdAdvertisement
Hide Ad> Highfield - 139 cases (+63). Rate per 100,000 people: 1,731.2.
> Kings Langley - 89 cases (+19). Rate per 100,000 people: 1,690.4.
> Leverstock Green - 100 cases (+33). Rate per 100,000 people: 1,347.2.
> Maylands and Adeyfield - 94 cases (+34). Rate per 100,000 people: 1,261.1.
Advertisement
Hide AdAdvertisement
Hide Ad> Markyate, Flamstead and Gaddesden - 87 cases (+20). Rate per 100,000 people: 1,509.4.
> Nash Mills and Bennetts End - 175 cases (+94). Rate per 100,000 people: 1,715.2.
> Warners End - 133 cases (+69). Rate per 100,000 people: 1,978.6.
> Woodhall Farm - 86 cases (+48). Rate per 100,000 people: 1,419.8.
Advertisement
Hide AdAdvertisement
Hide Ad> Northchurch and Potten End - 97 cases (+38). Rate per 100,000 people: 1,767.2.
> Berkhamsted Town - 119 cases (+28). Rate per 100,000 people: 1,829.4.
> Berkhamsted West - 134 cases (+45). Rate per 100,000 people: 2,009.9.
> Berkhamsted South - 113 cases (+31). Rate per 100,000 people: 1,928.
Advertisement
Hide AdAdvertisement
Hide Ad> Tring West and Long Marston - 88 cases (+4). Rate per 100,000 people: 1,467.9.
> Tring East, Wiggington and Aldbury - 74 cases (+3). Rate per 100,000 people: 1,403.1.
> Tring North - 67 cases (+16). Rate per 100,000 people: 1,298.4.
The figures can be found on the official UK Government website for data and insights on coronavirus - coronavirus.data.gov.uk.